State of the Lake – 2020
This story about the quality of Clark Lake’s water was written by Richard Moyer. Dr. Moyer, and his wife Lois, live on the north shore, west end. He is a professor emeritus of science education and natural sciences at College of Education, Health, and Human Services, University of Michigan-Dearborn.
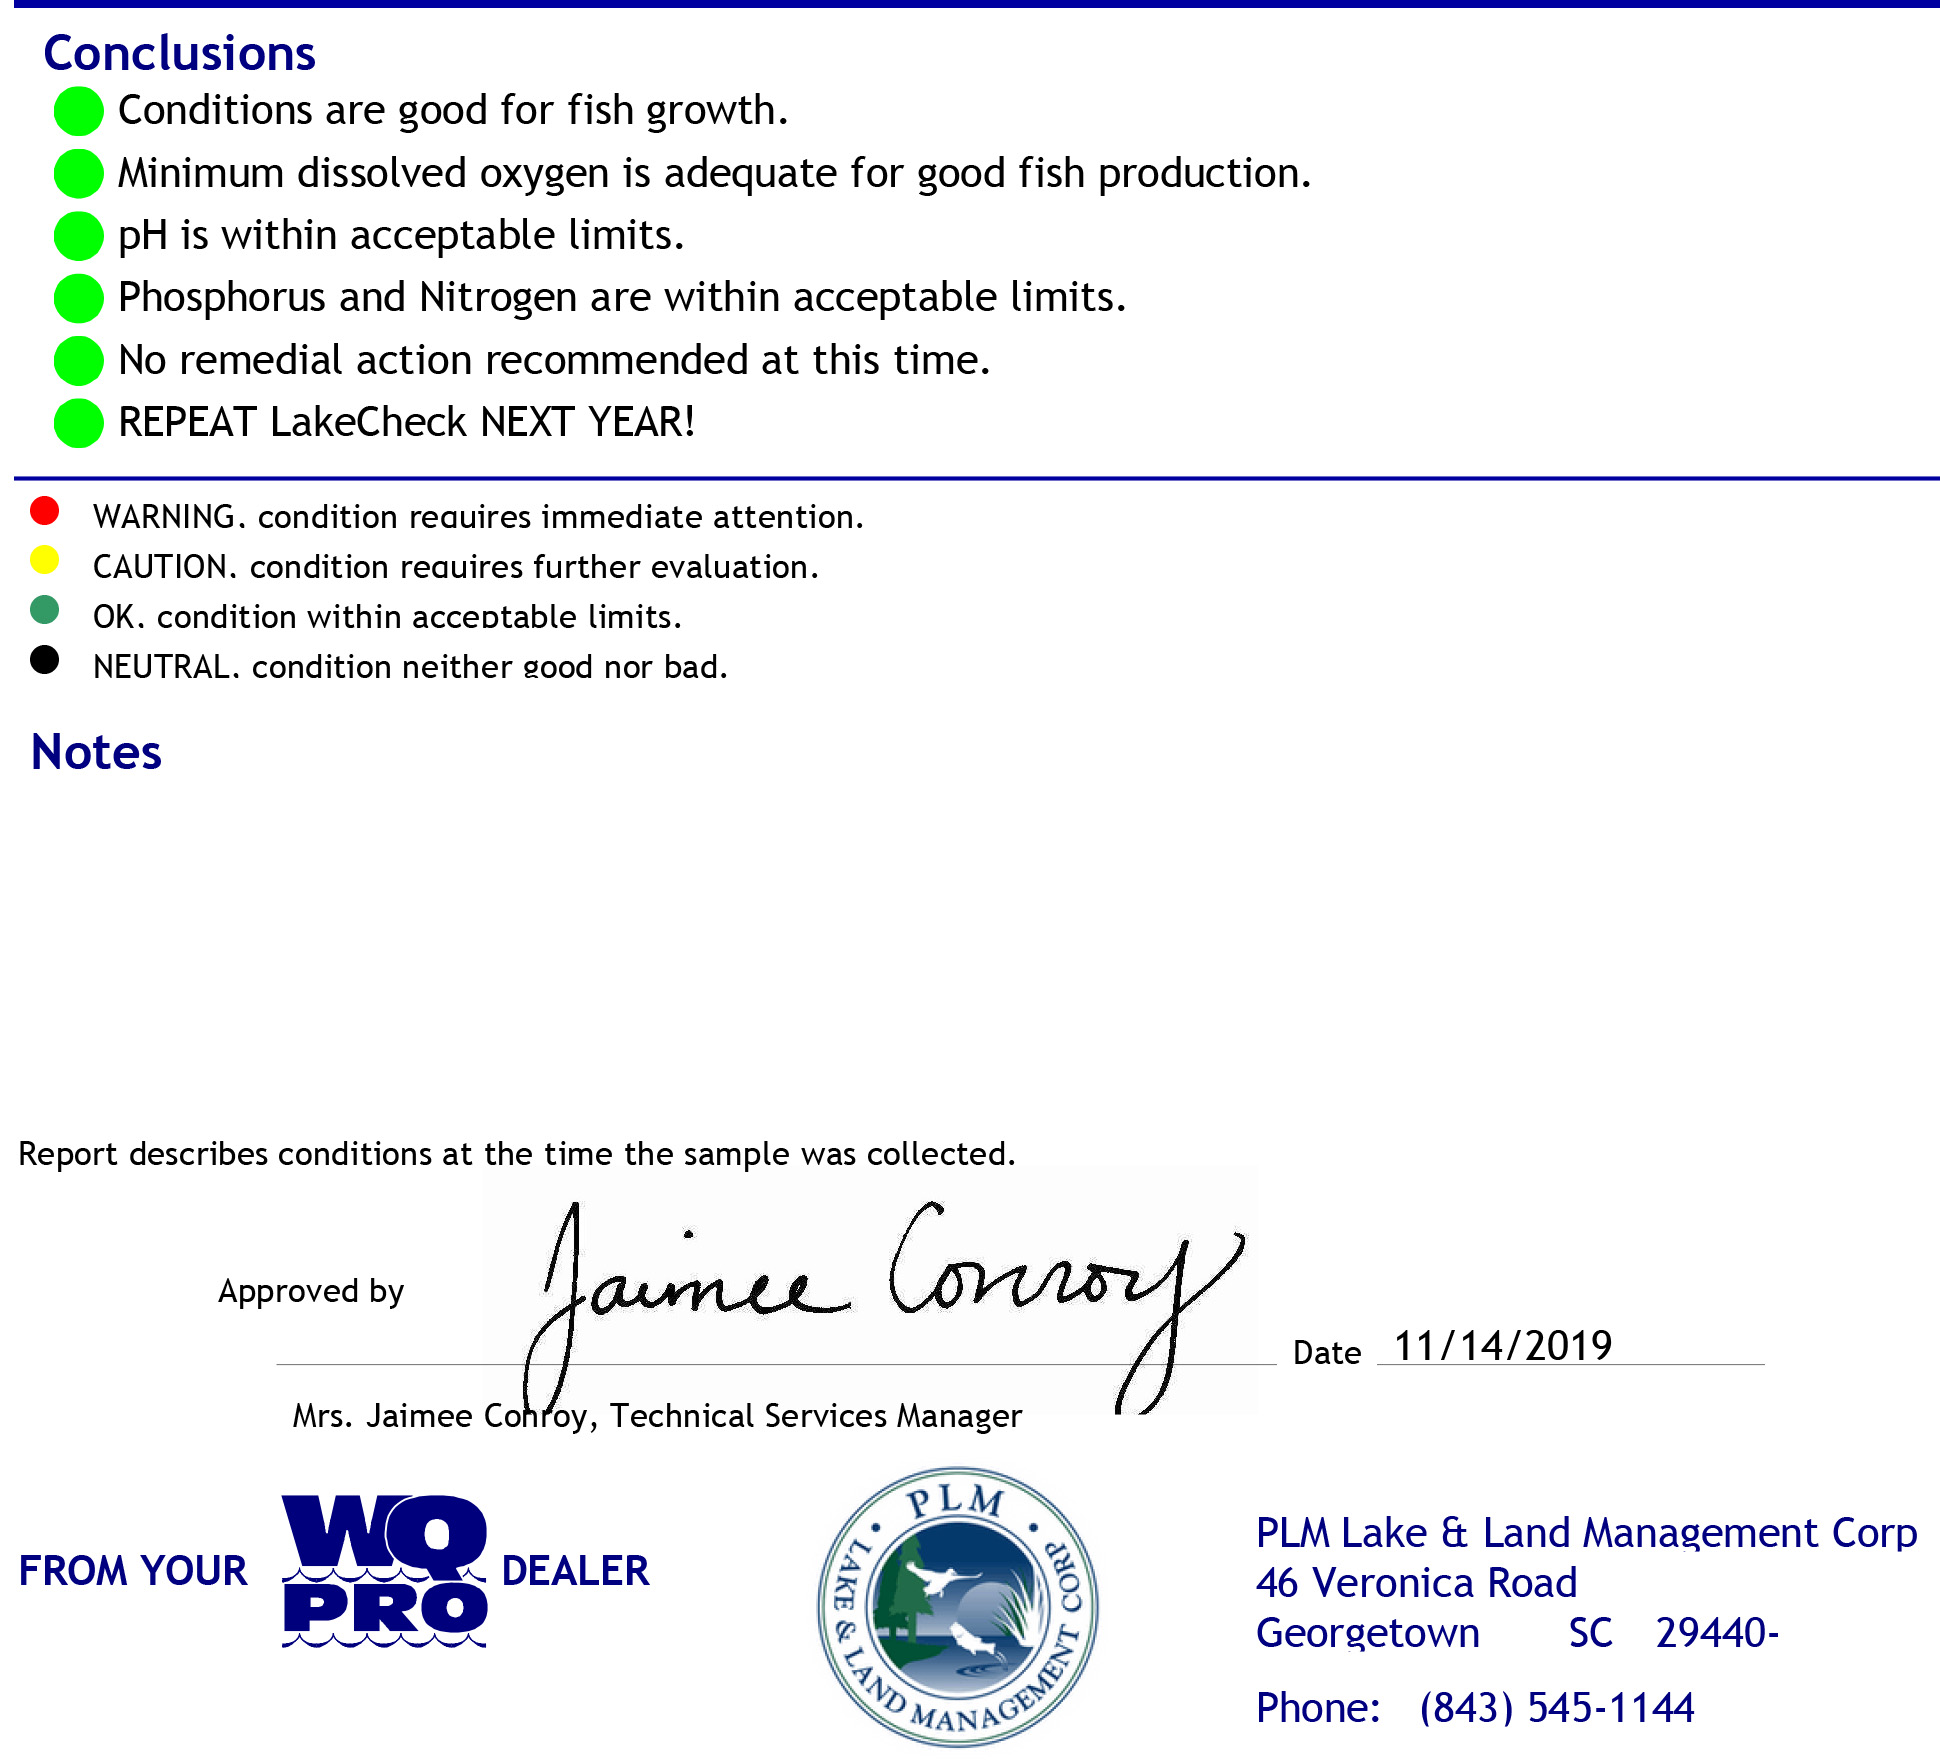
Last year I summarized the spring and fall “lake checks” completed by PLM on the water quality of Clark Lake. While 2020 hasn’t been the best of years in many ways, Clark Lake has fared pretty well. Once again samples were taken in late April and September. The overall conclusions were the same as last year:
• Conditions are good for fish growth
• Dissolved oxygen levels are adequate for good fish production
• pH is within acceptable limits
• Phosphorus and Nitrogen are within acceptable limits
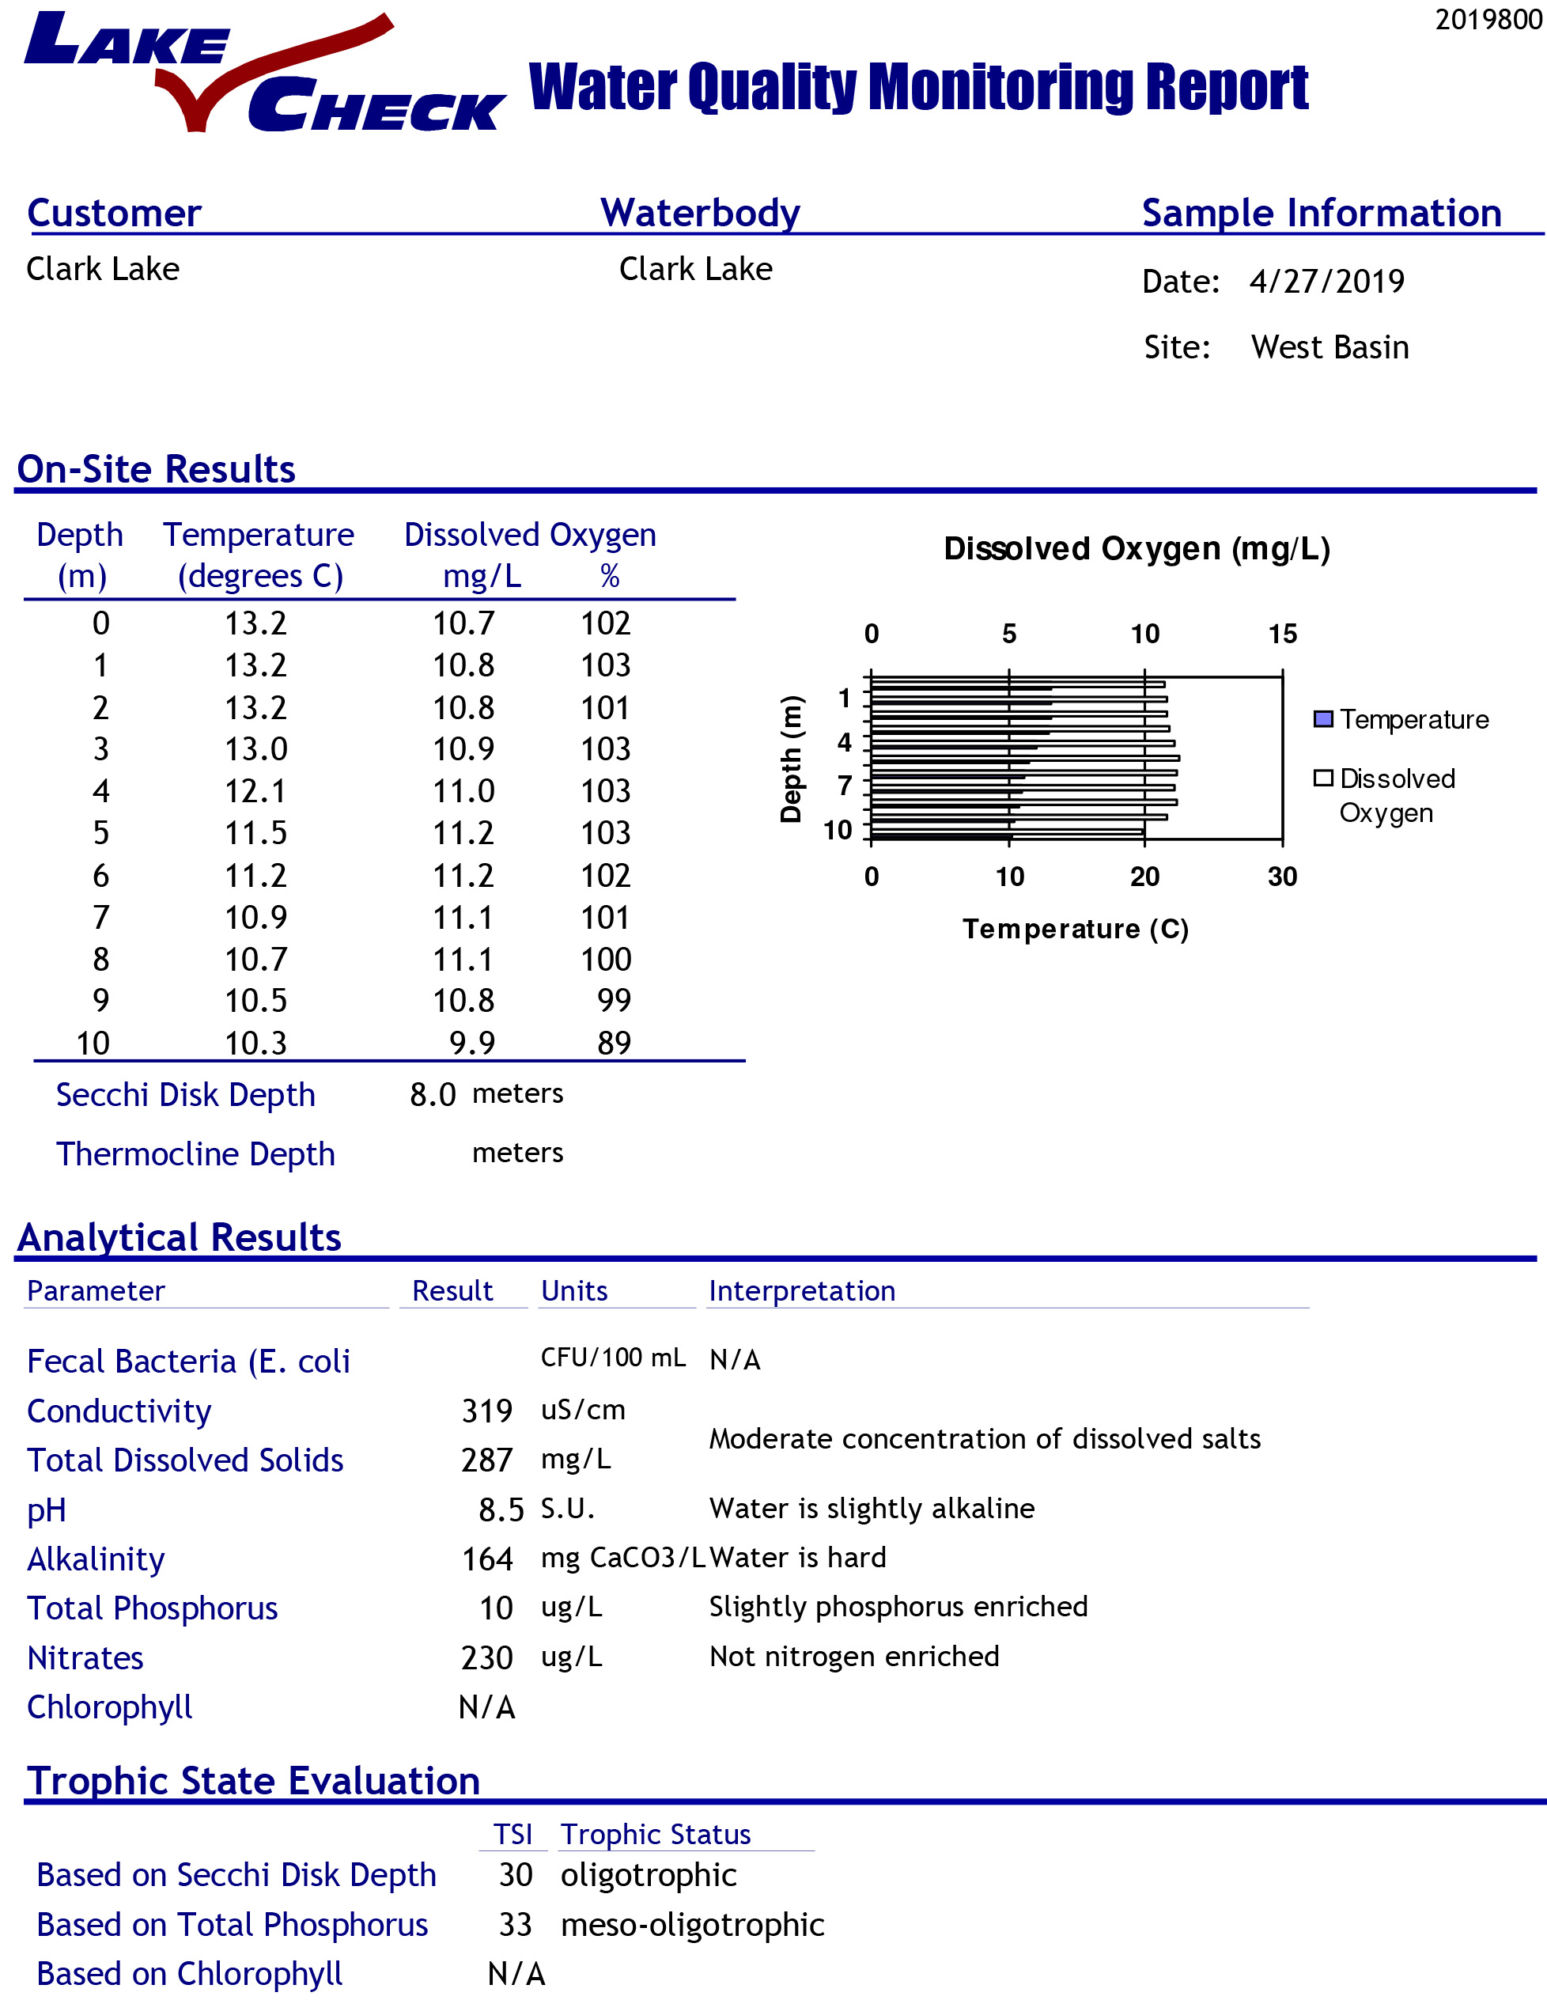
A year ago, I explained that lakes are classified overall by their trophic level—trophic relating to the amount of plant growth. Left alone, all lakes eventually evolve to eutrophic levels, essentially highly nutrient laden and ultimately filled with plant materials. The opposite is a clear lake with virtually no plant material, known as an oligotrophic lake. The translation from the Greek literally means few feeding (plants). Based on their findings, PLM classifies Clark Lake in three measures as meso-oligotrophic, which means essentially that it is in between eutrophic and oligotrophic leaning toward the latter. One measure found the lake slightly more eutrophic with classification of mesotrophic.
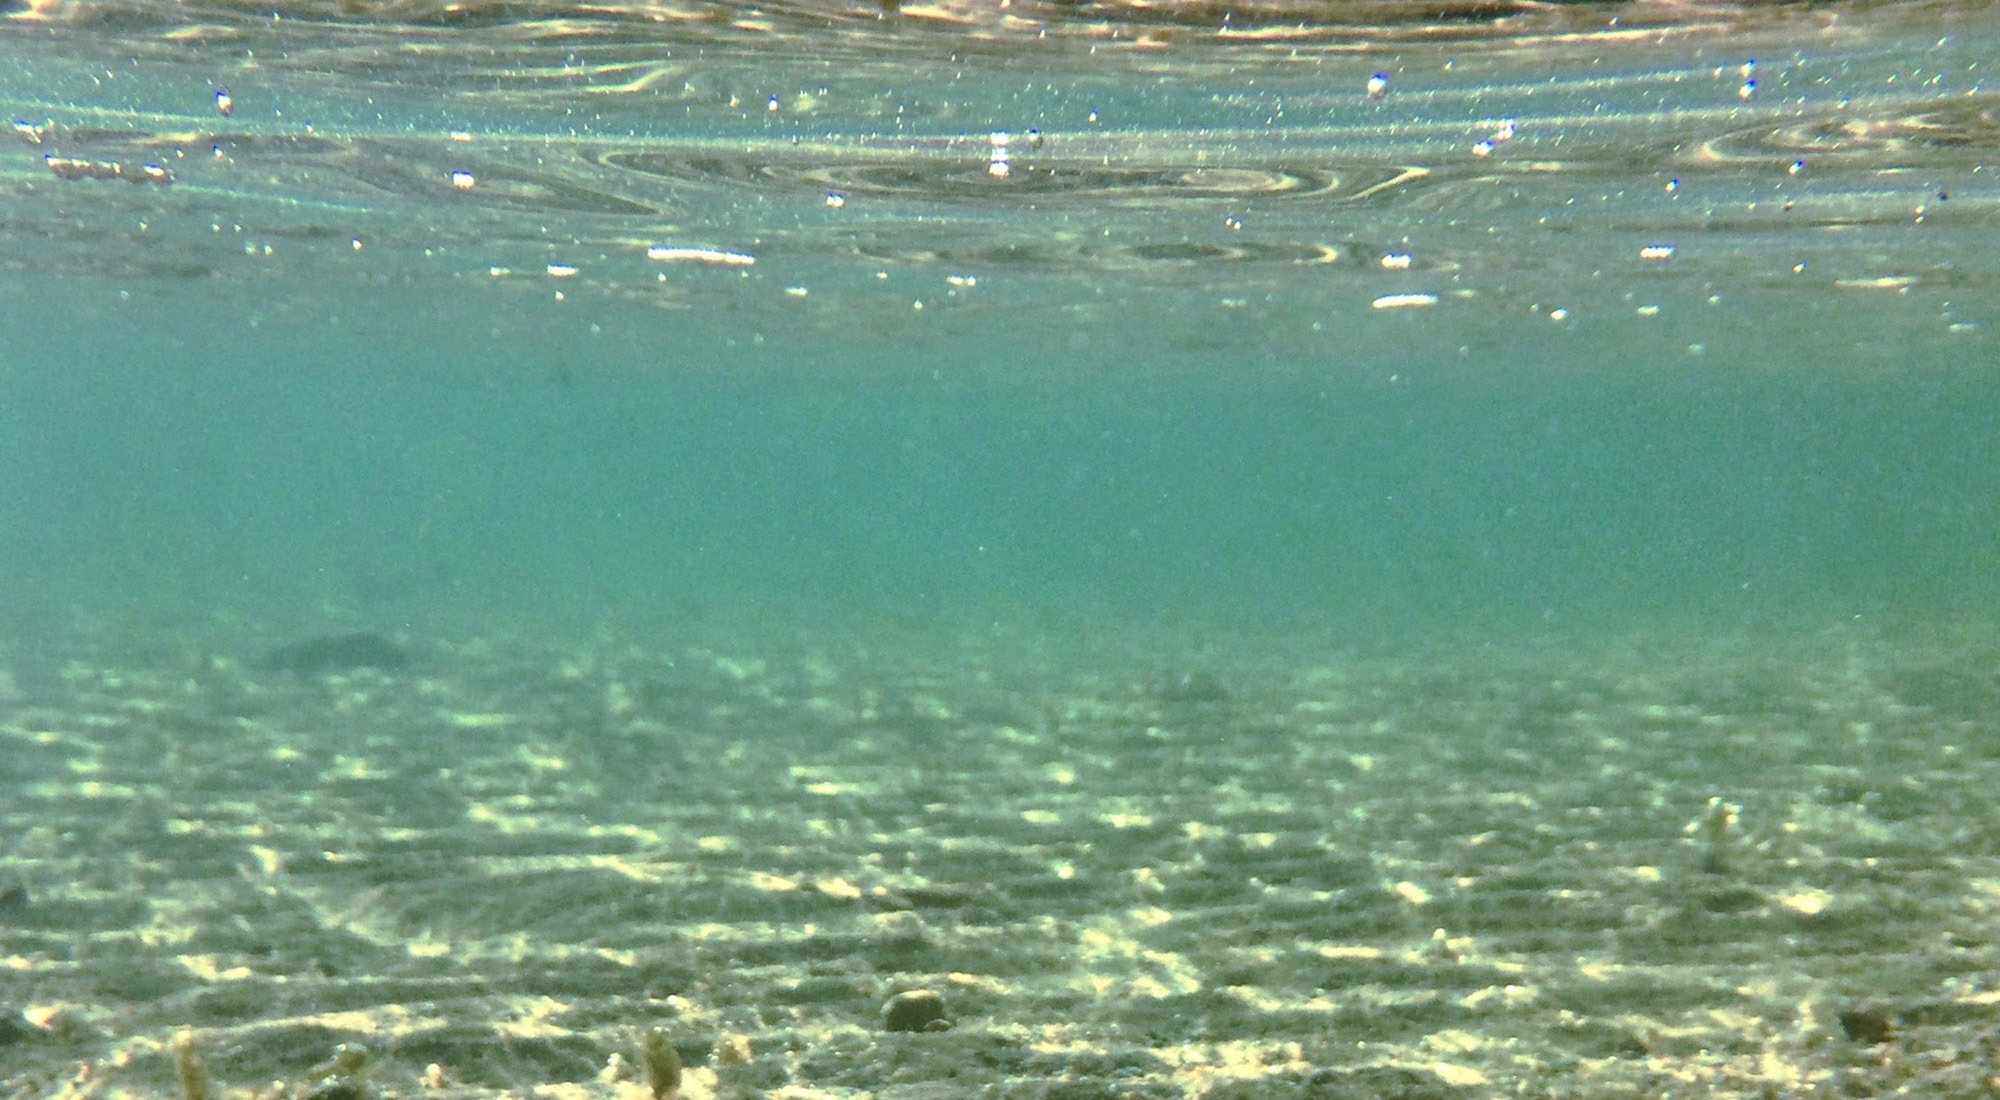 Clark Lake underwater. Photo: Brandi Zak
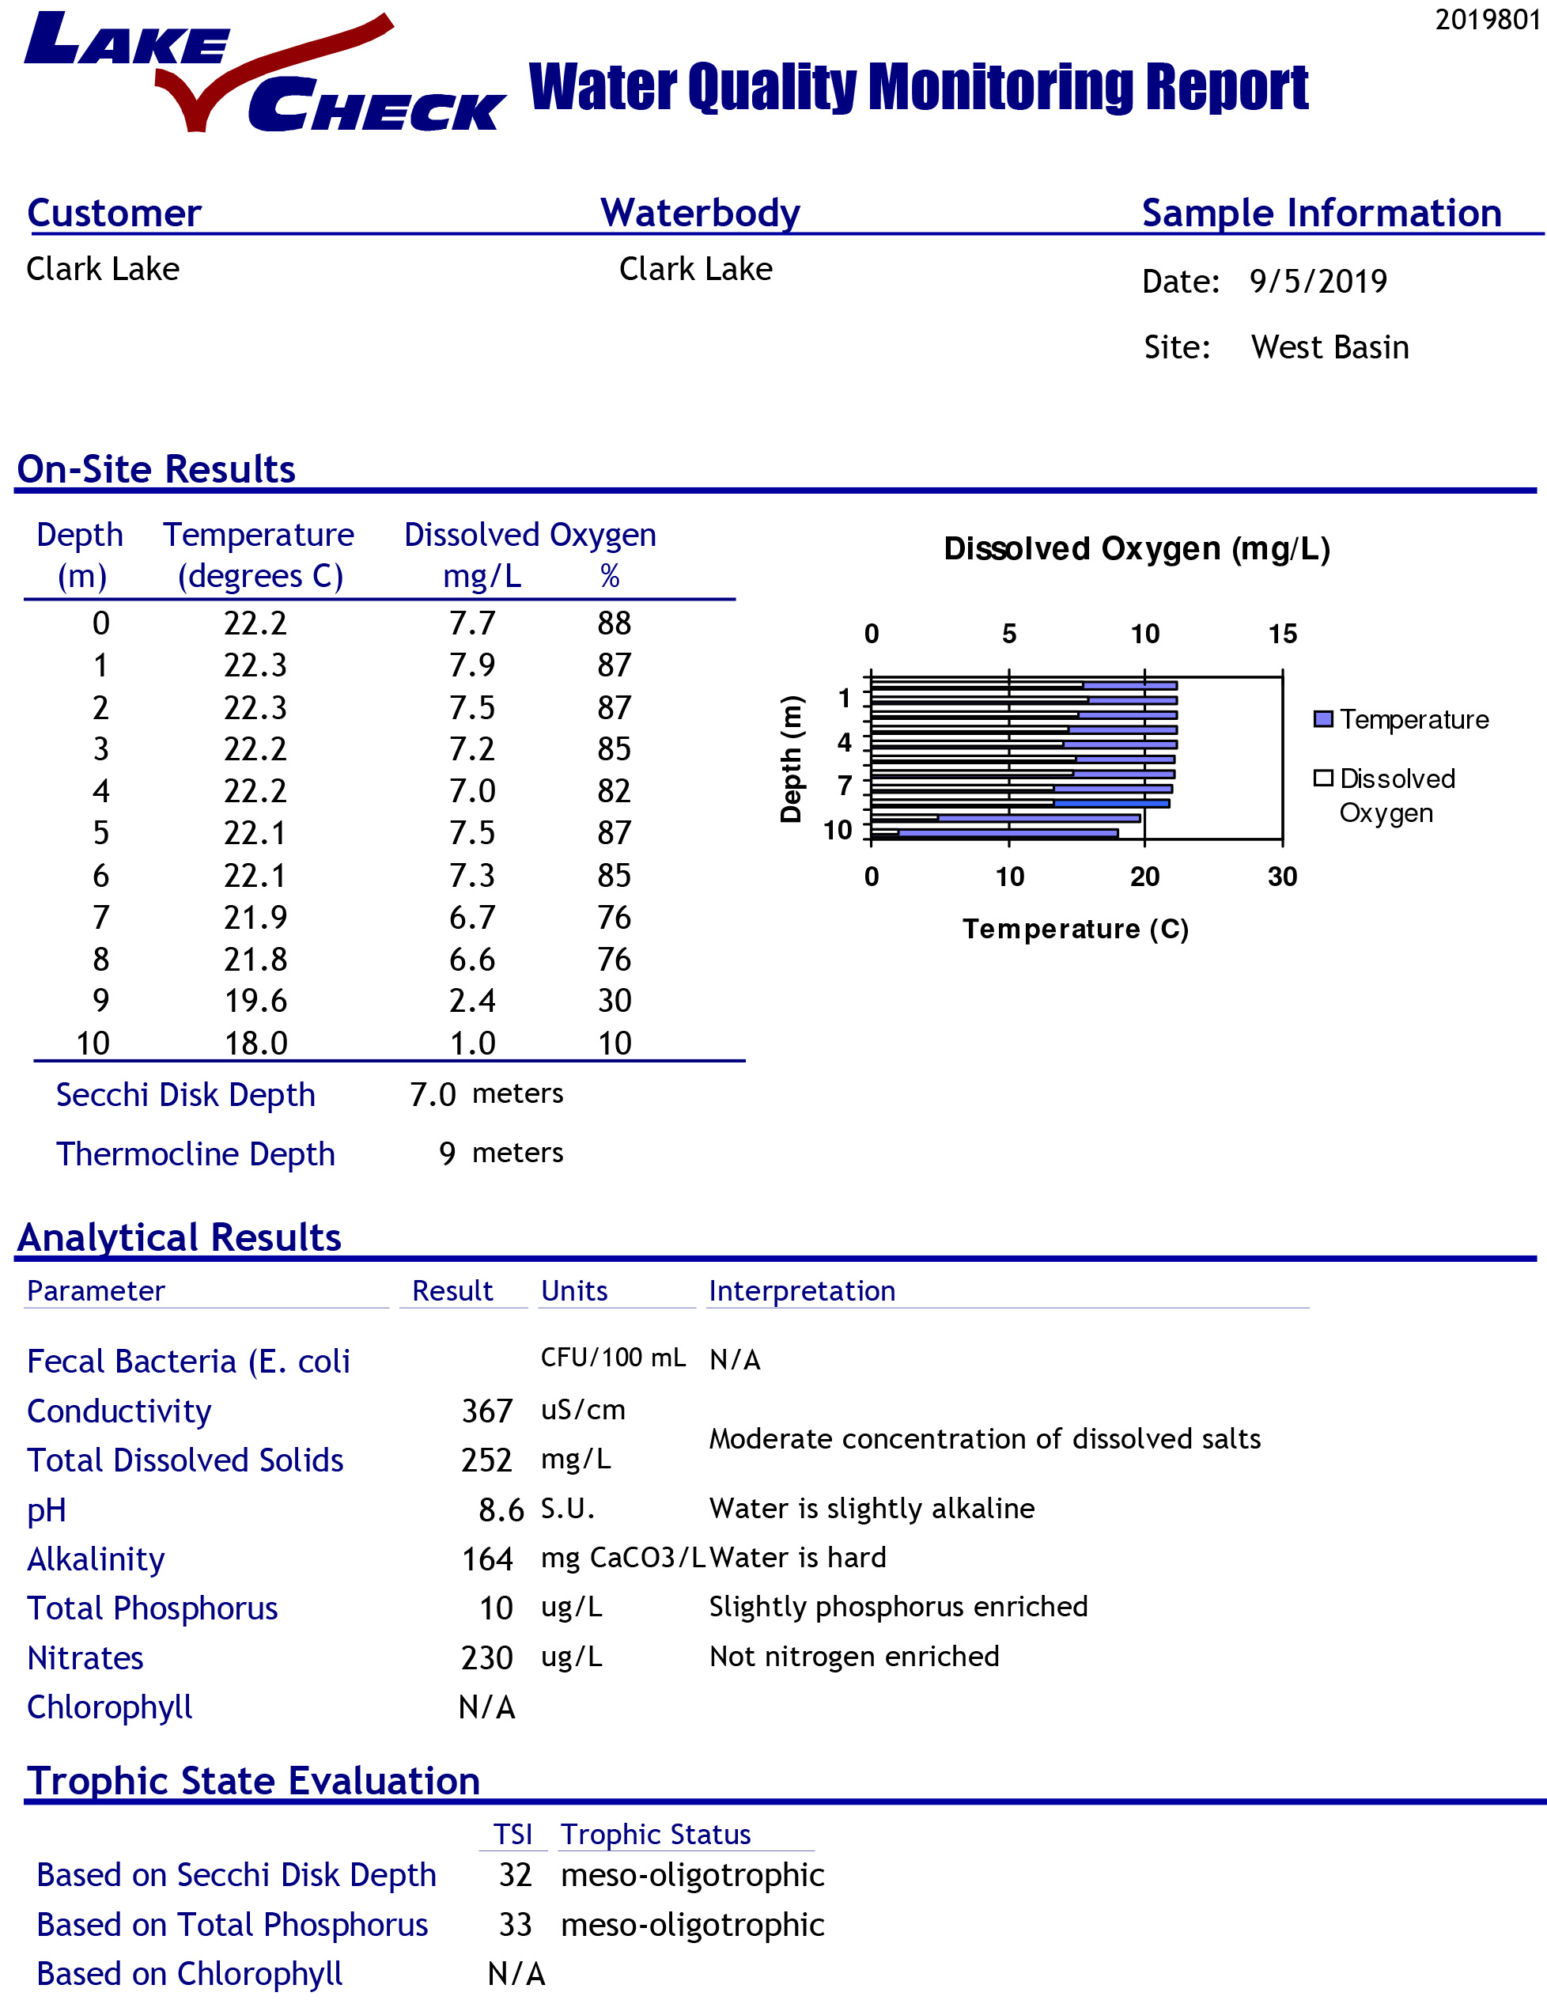
Healthy lakes have a dissolved oxygen level of greater than 6.5 mg/L (milligrams per liter). Our lowest level, in the fall at a depth of 10 meters was 7.5 mg/L. Spring readings, were found to be in the 10.5 to 11.5 mg/L which is near saturation of dissolved oxygen. As you look at the data (which follows) you may notice that the amount of dissolved oxygen is lower in the fall than the spring. Not anything to worry about—the amount of oxygen that can dissolve varies with temperature and cold water can hold more dissolved oxygen.
Clark Lake’s pH levels are nearly unchanged from a year ago and are well within healthy levels. Recall that pH is a logarithmic measure of how acidic or alkaline a substance is with pure distilled water being neutral at a pH of 7. Clark Lake is (still) slightly alkaline at about a pH of 8.5.
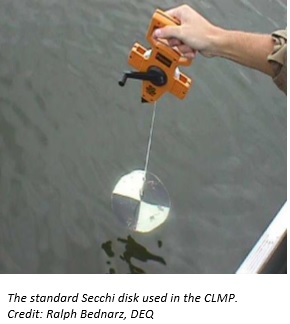 The clarity of the lake is also good as measured by a Secchi Disk, a black and white circle that is lowered into the water until it can no longer be seen. The greater the depth at which it can still be seen, the more clear the water. Here we slipped a bit in the fall reading. A year ago, the Secchi depth was 8 meters in the spring and 7 meters in the fall. In 2020, the Secchi depths were 6 meters and 3.5 meters. This is the one measure (mentioned above) that slipped to a mesotrophic level. We are still ok as generally Secchi readings greater than 5 meters are considered oligotrophic and those between 3 and 4.9 meters mesotrophic.
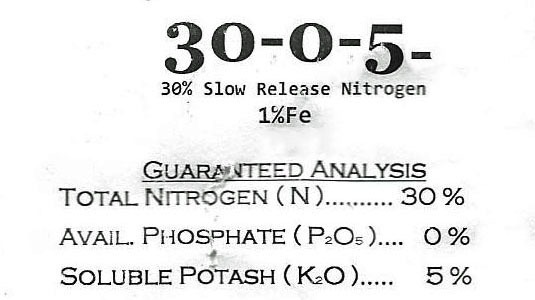
This fertilizer has no phosphorous–a good thing.
Last year, I made a suggestion (plea) that we all consider the fertilizers we put on our lawns. Eventually, they mostly end up in the lake. The phosphorous level inched up in the spring from 10 micrograms per liter last year to 13 in 2020. The accompanying rating from PLM also inched up from “slightly phosphorous enriched” in 2019 to “moderately phosphorous enriched” in 2020. The good news is that by fall of this year the level had returned to last year’s levels. The middle number on a bag of fertilizer represents the amount of phosphorous, the bigger the number the greater the amount of phosphorous. The three numbers represent the amounts of nitrogen, phosphorous, and potassium. Phosphorous free fertilizers are available for use on lakeside lawns.
So, in summary, our lake is quite healthy. It’s not quite perfect (but very good) in its chemistry, and still perfect in all of our hearts.
To review PLM’s report for both spring and fall 2020, please click here.
State of the Lake – December 2019
By Richard Moyer, Ed.D.
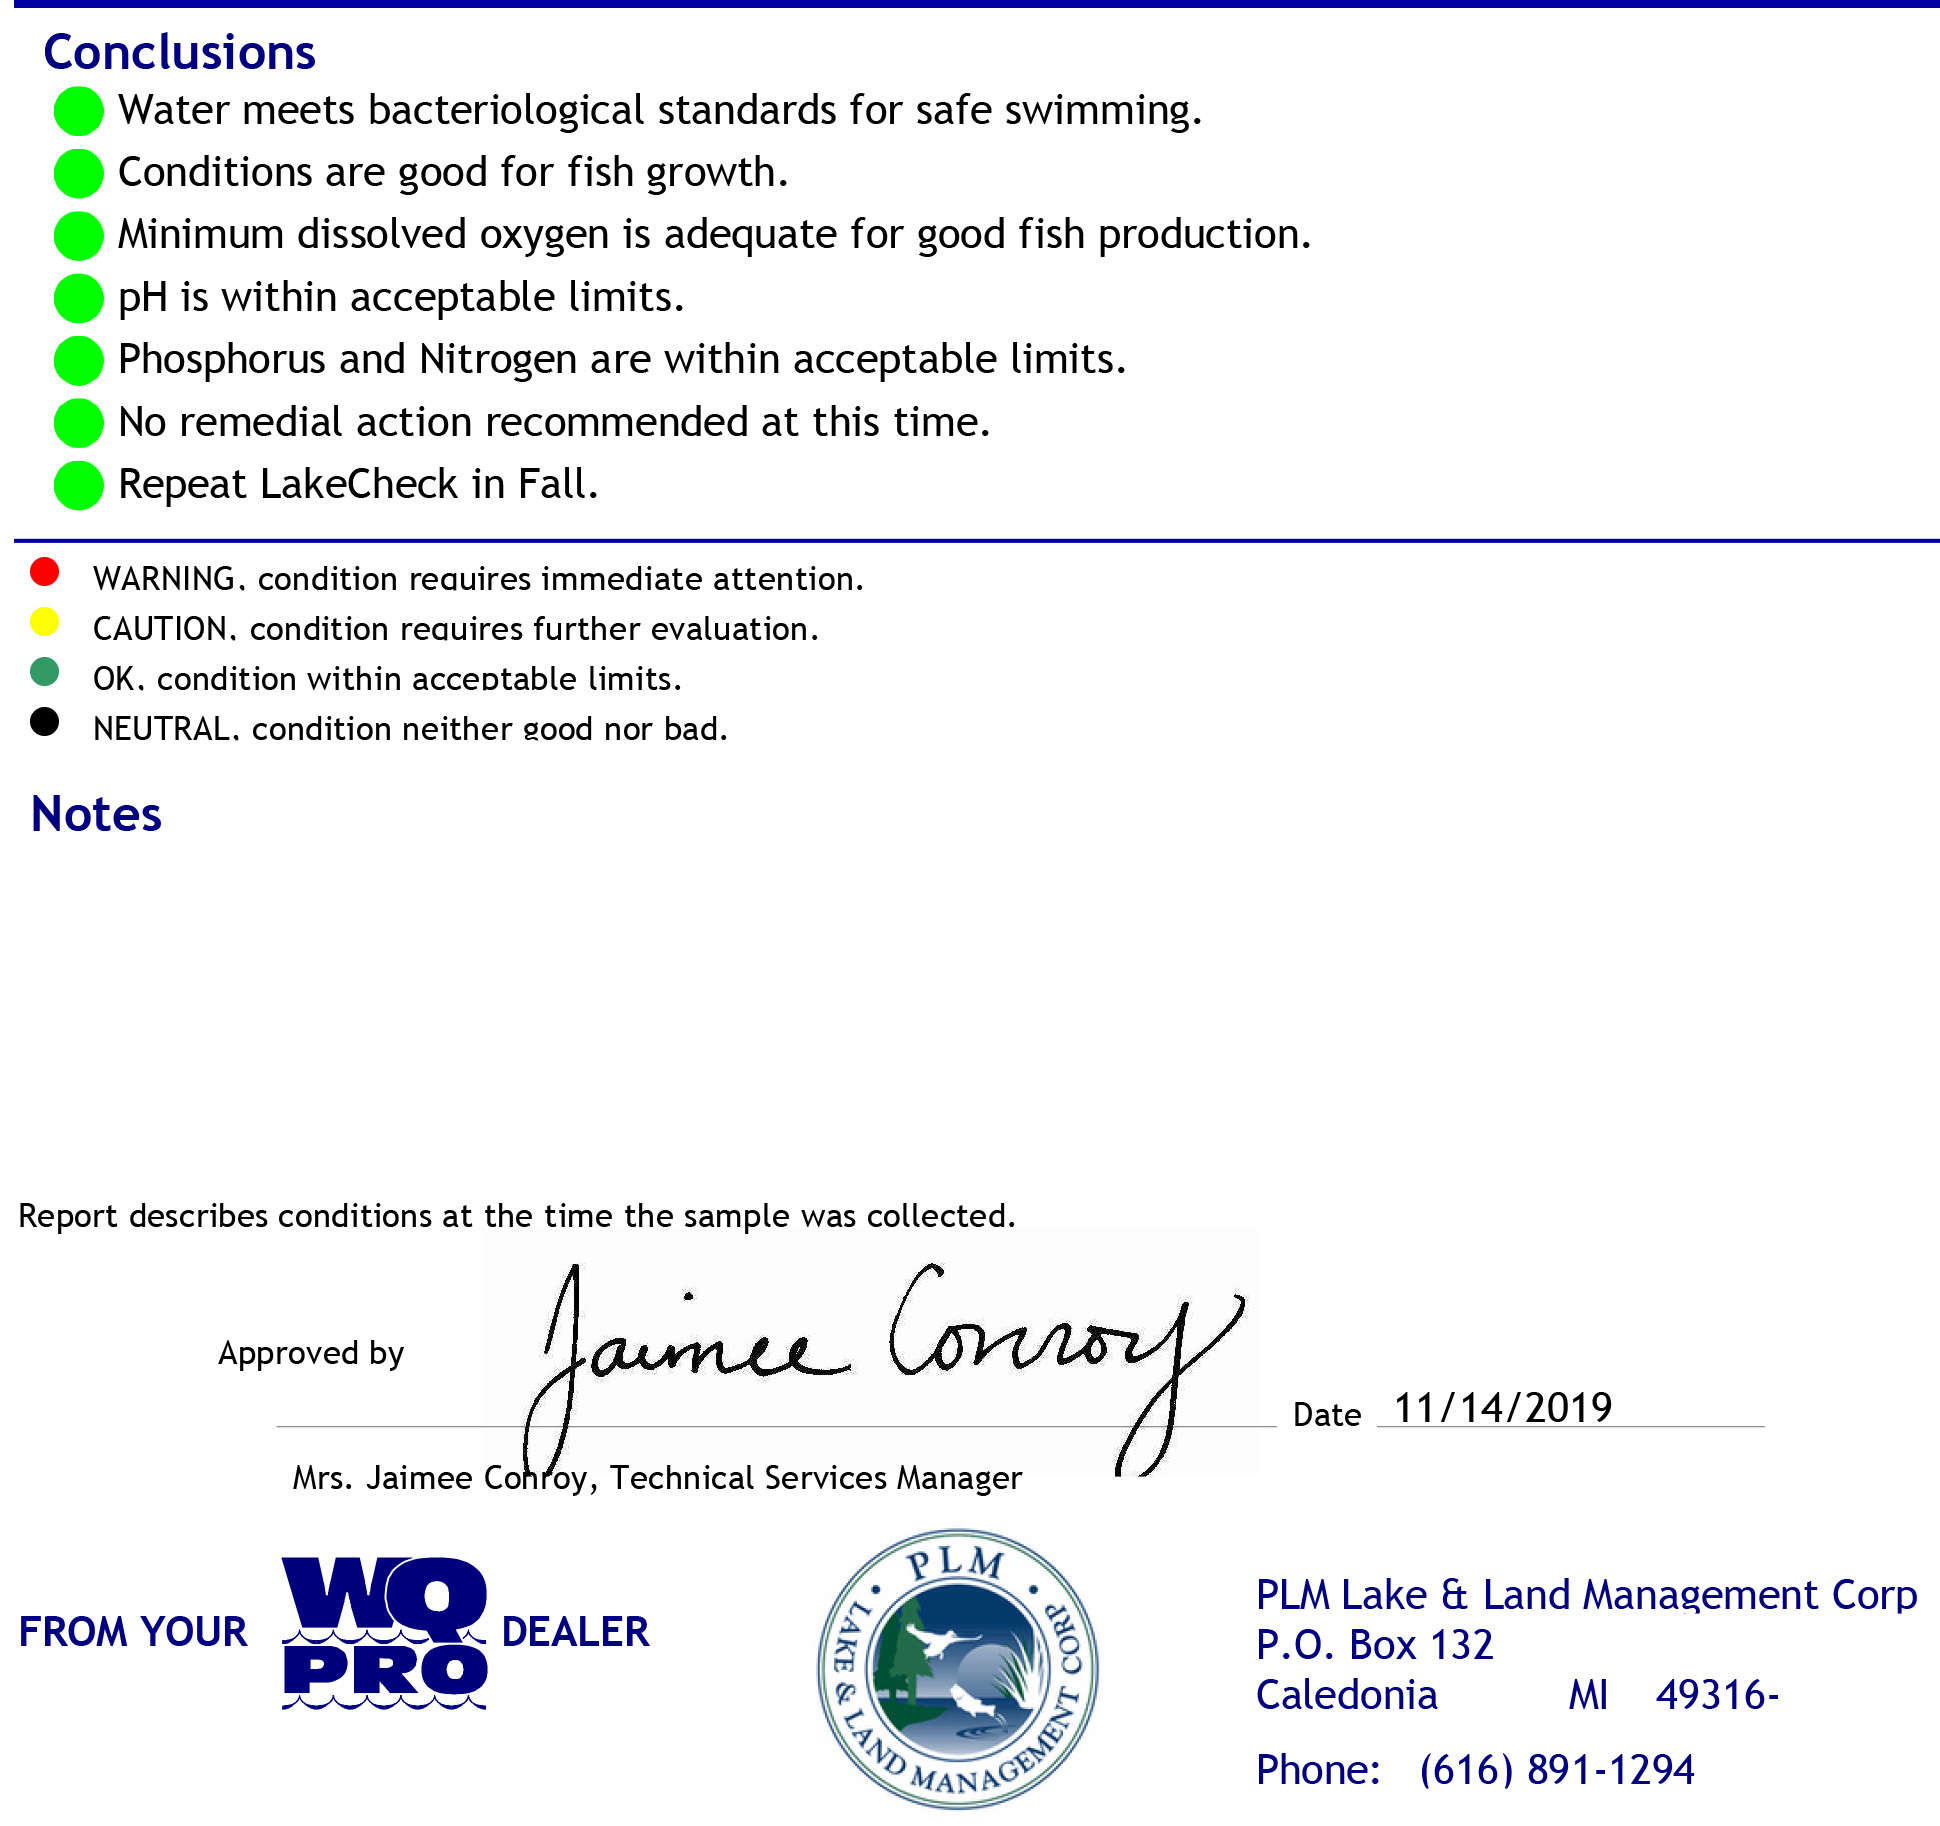
The results for this year’s monitor of water quality are in, and our lake is doing quite well. Samples were taken in late April and again in early September by PLM, the company that treats the lake for invasive species.
Their conclusions are all positive:
- The water meets bacteriological standards for safe swimming.
- Conditions are good for fish growth
- Minimum dissolved oxygen is adequate for good fish production
- pH is within acceptable limits
- Phosphorus and Nitrogen are within acceptable limits
Lakes are often classified on their so-called trophic level. Trophic means nutrition, or growth. As a natural process, all lakes eventually become eutrophic which essentially means, “well nourished.” Eutrophic lakes are nutrient rich and biotic growth increases. Over thousands of years, the increased plant material eventually fills in the lake. Contrasting a eutrophic lake is what is called an oligotrophic lake, which exhibits clear water and a relatively low number of plants. Meso-oligotrophic conditions fall somewhere in between.
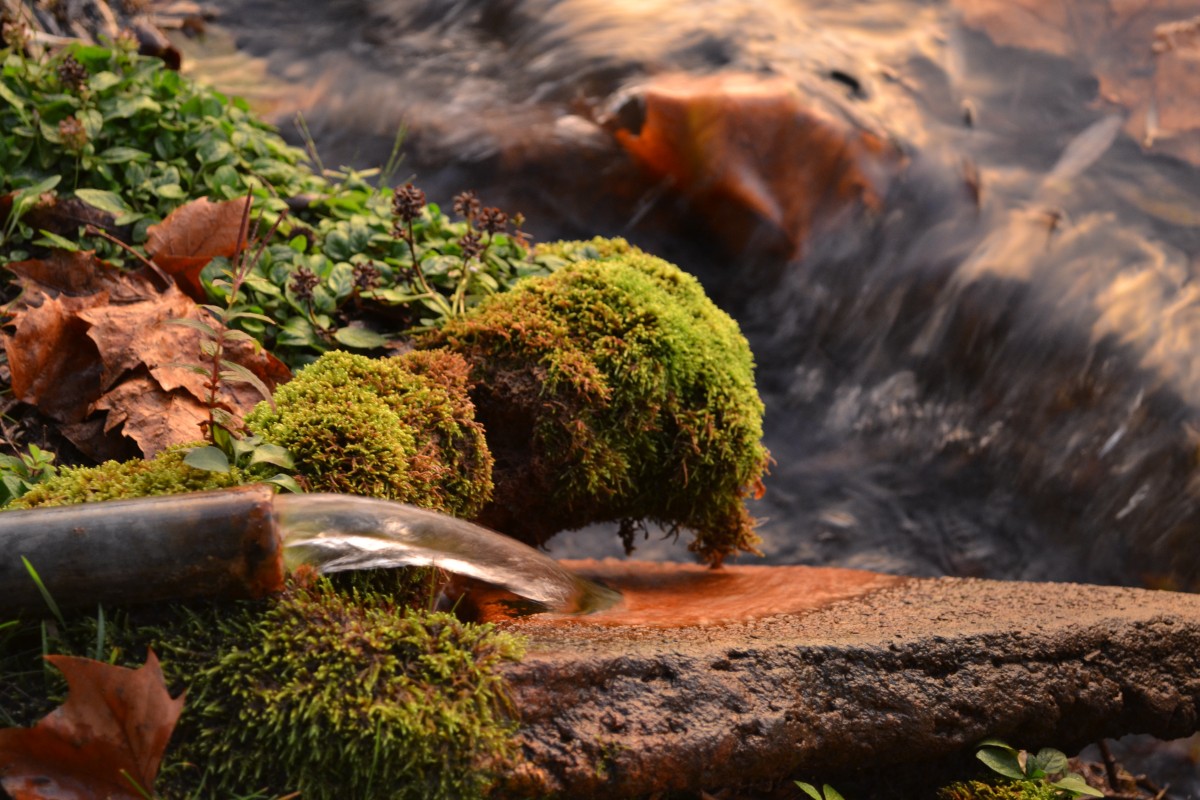
 One of Clark Lake’s 150 springs
Let’s look at the numbers. The pH, or acidity, of Clark Lake was found to be 8.5 in April and 8.6 in September. pH is a measure of acidity. It ranges from a value of 1 to 14; the lower the number the more acidic and the higher, the more basic or alkaline. A pH of 7 is neutral and is what pure, distilled water would measure. pH is a logarithmic scale which means that a pH of 8 is ten times greater than a value of 7. We’re in good shape here as research has determined that a pH between 6 and 9 results in a healthy and diverse fish population. Increased algae and weed growth can cause an increase in pH—more CO2 (which is acidic) is required for the additional photosynthesis making the water less acidic and thus increasing the pH.
One measure of a lake’s health (and trophic state) is related to its clarity and measured with a simple device called a Secchi Disk. A black and white disk about 8 inches in diameter is lowered into the water. The depth at which it becomes invisible is recorded. The clearer the water, the deeper the depth at which the disk can still be seen. PLM found a value of 7 meters in September and 8 meters in April. The 8 meter reading is classified as oligotrophic while the 7 meter reading in September is meso-oligotrophic.
Another important measure of trophic level is the amount of phosphorus in a lake. Phosphorus is one of the main ingredients in fertilizers used on lawns and agricultural fields. It’s also found in animal and human waste. The middle number on a bag of fertilizer is a measure of the amount of phosphorus. Fertilizers on our lawns get washed directly into the lake, increasing the lake’s level of phosphorus. Increased levels of phosphorus feed the growth of algae and weeds thus adding to the nourishment or eutrophication of the lake.
 How well did we do? In both tests phosphorus levels were found to be 10 micrograms per liter of water, a level considered to be, according to PLM, “slightly enriched.”
So, while we’re not perfect, Clark Lake is in pretty good shape (we all knew that anyway). PLM will test again in the spring and fall next year. Perhaps in the mean time, we all might want to consider what we put on our lawns.
For several years, the water was tested by lake resident Carolyn Zader. Now PLM does this as part of their agreement to thwart invasive weeds.
Dr. Moyer, who wrote this article, is a Clark Lake resident, and lives on the North Shore, west end.
Below is the full PLM report.
State of the Lake – March 9, 2017
The latest water quality tests reveal Clark Lake to be in good condition, but not without some concerns.
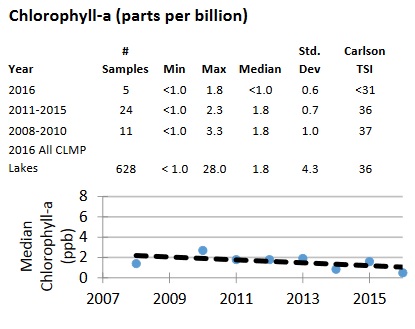
There are test three categories—water clarity, amount of phosphorus (stimulates plant/algae growth), and the amount of chlorophyll (indicates the amount of plant/algae growth). These three are sometimes connected. More phosphorus can stimulate algae and plant growth (chlorophyll). More chlorophyll can make the water less transparent. The most recent test confirms a trend line showing less chlorophyll which is a good thing.
 The news was mixed on phosphorus. The spring test was in line with previous years. The summer test showed more of it.

In spite of less chlorophyll, the results confirm the trend of less transparency.
 What do these three measures tell us about Clark Lake? They tell the story if the natural aging process of the lake is slowing or speeding up. According to the Great Lakes Monitoring Program, natural aging, or eutrophication, results “from the gradual accumulation of nutrients, increased productivity [of weeds and algae], and a slow filling in of the lake basin with accumulated sediments, silt, and muck.”
What can be done? Phosphorus speeds up the aging process and is found in many fertilizers. Stop its path to the lake and you slow the aging process.
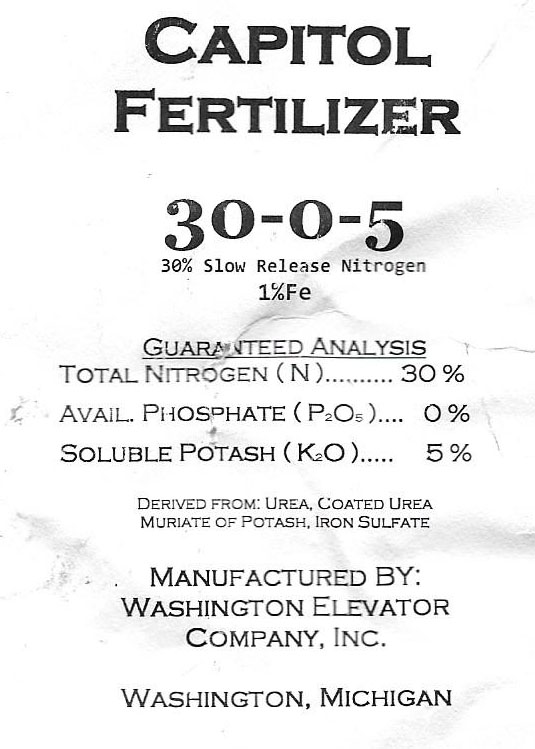
Every fertilizer displays three numbers. The center number is phosphorus. The illustration shows the content of a fertilizer sold in this area. The first number on the label is nitrogen; the second, phosphorus; and the third, potassium. If you’re looking to say “no” to phosphorus, simply look for a “zero” middle number.
Also recommended is to keep fertilizer away from the shoreline and/or drains that empty to the lake.
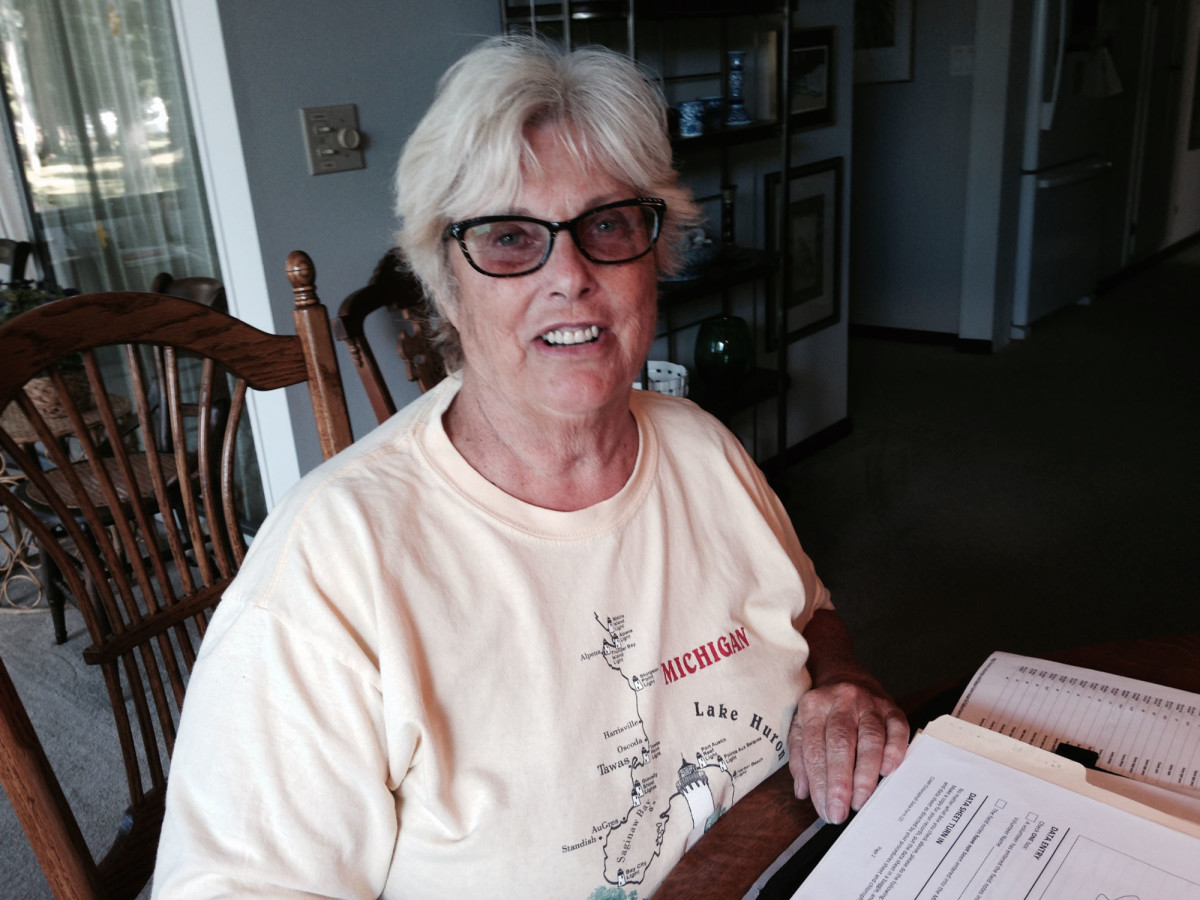 Each year the waters of Clark Lake are tested multiple times to ensure that our lake is in good condition. The testing has been done in recent years by Carolyn Zader, who volunteers her time. The lab costs have been borne by the Clark Lake Spirit Foundation, publisher of this website. Carolyn is looking for help on this project. Interested? You can reach out to her thru clarklakespirit@gmail.com. As Carolyn and others will tell you—“it’s our lake to save!”
For the complete report, please click here.
State of the Lake – June 4, 2016
Each year the waters of Clark Lake are tested multiple times to ensure that our lake is in good condition. The testing has been done in recent years by Carolyn Zader, who volunteers her time. The lab costs have been borne by the Clark Lake Community Center.
Testing continues through the summer, so the latest test results are from the previous year. The 2015 results aren’t a perfect 10, but they show that Clark Lake is in significantly better shape than other lakes that were tested in Michigan. But that should surprise no one here!
There are test three categories—water clarity, amount of phosphorus (stimulates plant/algae growth), and the amount of chlorophyll (indicates the amount of plant/algae growth).
What do these three measures tell us about Clark Lake? They tell the story if the natural aging process of the lake is slowing or speeding up. According to the Great Lakes Monitoring Program, natural aging, or eutrophication, results “from the gradual accumulation of nutrients, increased productivity [of weeds and algae], and a slow filling in of the lake basin with accumulated sediments, silt, and muck.”
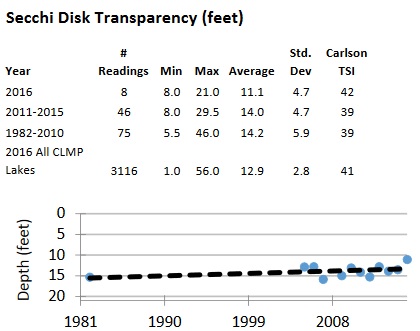
Transparency measures how clear the water is. The deeper you can see the test disk (known as a secchi disc—see illustration), the better. The nine tests in 2015 show the average depth was 13.6 feet. The 43 tests between 2010-2014 and 1982-2009 results averaged 14.1 feet. The half-foot difference is not considered statistically significant. Clark Lake does better than the average of all lakes tested for transparency–12.6 feet.
Phosphorus stimulates plant growth, leading to eutrophication. Phosphorus is monitored once in the spring and once in the summer. Spring phosphorus was 8 parts per billion in 2015, up from the 2010-2014 average of 6 ppb. A smaller number, indicating less phosphorus, is preferred.
The summer phosphorus in 2015 was 10 ppb, up from 8 ppb in spring. The summer number was also greater than the 2010-2014 average of 8.8 ppb. Both spring and summer measures for Clark Lake were considerably less than the average of other Michigan lakes—spring 11.5 and summer 13.2, and that’s good for us.
Chlorophyll measures the concentration of small plants in the water, such as algae. Lower numbers are better. Chlorophyll was up slightly from 2014, but since 2009, it has been trending down. Again, Clark Lake scores better than the average.
In all, the results for Clark Lake look good, but not straight A’s. What can be done? Phosphorus speeds up the aging process and is found in many fertilizers. Stop its path to the lake and you slow the aging process.
Every fertilizer displays three numbers. The center number is phosphorus. The illustration shows the content of a fertilizer sold in this area. The first number on the label is nitrogen; the second, phosphorus; and the third, potassium. If you’re looking to say “no” to phosphorus, simply look for a “zero” middle number.
Also recommended is to keep fertilizer away from the shoreline and/or drains that empty to the lake (there are several drains like this around the lake them).
After a number of years of faithfully performing these tests, Carolyn Zader would like to retire. Do you know of anyone who can take over this important work? If so, please email clarklakespirit@gmail.com.
As Carolyn and others will tell you—“it’s our lake to save!”
State of the Lake – August 3, 2015
Carolyn Zader lives on the north side of the lake near Pleasant View.
Every year Carolyn Zader performs a series of tests on the waters of Clark Lake. Five months of each year, she gathers samples that are shipped to a lab for testing and takes readings on water clarity. The water samples are tested for their content of phosphorous and chlorophyll. The less of it found in the lake, the better as both substances contribute to aging the lake.
Like many at the lake, Carolyn is a volunteer and she devotes significant time and effort to this project. Below is her report on the water of Clark Lake for 2014 (since testing is going this summer, we’ll see the 2015 report next year).
STATE OF THE LAKE 2014
After comparing scores of the last four years of the health of our lake, it appears we are heading in the right direction. A worthy goal is to slow down the eutrophication of our lake. Eutrophication is the filling in of our lake with runoff and sediment. A direct human effect on the process is the use of fertilizers, especially those with phosphorus. Phosphorus free fertilizers are available and easy to find, so if you feel you must fertilize, use the phosphorus-free and you will be helping to keep our lake healthy.
Lakes are classified based on their productivity. Low productive lakes with deep clear water and little aquatic plant life that support cold water fish are known as oligotrophic. As you add plant life and less depth, next is mesotrophic followed by eutrophic. A shallow, weedy, mucky lake is hypereutrophic. So how is Clark Lake classified? The answer lies in the tests we conduct.
We complete three tests for water quality: transparency, thosphorus and chlorophyll. Lakes are scored using what is known as the Carlson’s TSI Score:
The range for transparency is 25 – 64. The mean score for a healthy mesotrophic lake is 41. Our 2014 score was 39.
The range for phosphorus is 27 – 66. The mean score for a healthy mesotrophic lake is 39. Our score for 2014 was 41.
The range for chlorophyll is 31 – 61. The mean score for a healthy mesotrophic lake is 39. Our score for 2014 was 31.
Good. So, measured against other lakes, ours is, on the whole, pretty healthy.
With an overall average TSI score of 40 based on all three tests, Clark Lake is rated as between the oligotrophic and mesotrophic lake classification. The lake leans slightly more more meso than oligo.
Note: Carolyn is looking for help on this project. Are you interested? Please email clarklakespirit@gmail.com.
STATE OF THE LAKE
May 2014
Carolyn Zader reports that the latest test of Clark Lake water shows improvement over the previous year. The test measures three characteristics–transparency, phosphorus and chlorophyll. The amount of phosphorus detected was way down, which is the area of greatest improvement. Transparency also was better.
Carolyn has tracked Clark Lake’s water quality–using the same metrics–over a period of years. To read Carolyn’s report that includes a five year perspective, please click here.
STATE OF THE LAKE
May 2013
-Carolyn Zader
Comparing the last five years scores of the health of our lake, we continue to head in the right direction.
 Our aim is to slow down the human effect on the natural eutrophication of our lake, which is the natural use and filling in of our lake basin with runoff and sediment. A direct human effect is the use of fertilizers, especially those with phosphorus. Phosphorus-free fertilizers are available and easy to find, so if you feel you must fertilize, use the phosphorus-free and you will be helping to keep our lake in a healthy mesotrophic state. (Lakes are classified based on their productivity. Low productive lakes with deep clear water, little aquatic plant life and supporting cold water fish are known as oligotrophic. As you add plant life and less depth, next is mesotrophic (Clark Lake), then eutrophic, and finally a shallow, weedy, mucky hypereutrophic lake.)
We complete three tests for water quality: transparency, phosphorus and chlorophyll. Lakes are scored using what is known as the Carlson’s TSI Score.
The range for transparency is 25 – 64. A higher score is better, and the mean score for a healthy lake of our type is 41. Our score for 2009 was 37, 2010 was 41, 2011 was 39, 2012 was 38; and the latest score, 2013, was 40.
The range for phosphorus is 27 – 66. For this measure, a lower score is better. For a healthy lake of our type, the mean score is 39. Our score for 2009 was 36, 2010 was 34, 2011 was 30, 2012 was 39 and our most recent score was 30, which is way down!
The range for chlorophyll is 31 – 61. A lower score is better and the mean score for a lake of our type is 39. Our score for 2010 was 40, 2011 was 36, 2012 was 36, and for 2013 37 (up one point).
The drop in phosphorus is especially encouraging. So, our lake is, on the whole, looking better.