In the past, researching annual rain and snowfall has meant relying on measurements from nearby places like Jackson’s Reynolds Field. For 2024, that has changed. Measurements were taken throughout the year at Clark Lake and are reported in the chart below. But first, a look at the methodology.
When charting precipitation, you soon find that results can be vary, even at Clark Lake. Here’s an example. On one occasion, a drenching could be observed taking place from Hyde Road extending to the east, but stopping at a north-south line at Mud Point. Only a few sprinkles reached the Eagle Point shoreline. It’s no wonder that that those with rain gauges at the lake have reported differing amounts for the same event.
At this location along Eagle Point Road, all three of these devices have an open view of the sky. They are shielded to the extent they are not affected by wind coming off the lake. Care was taken to record measurements in an Excel spreadsheet.

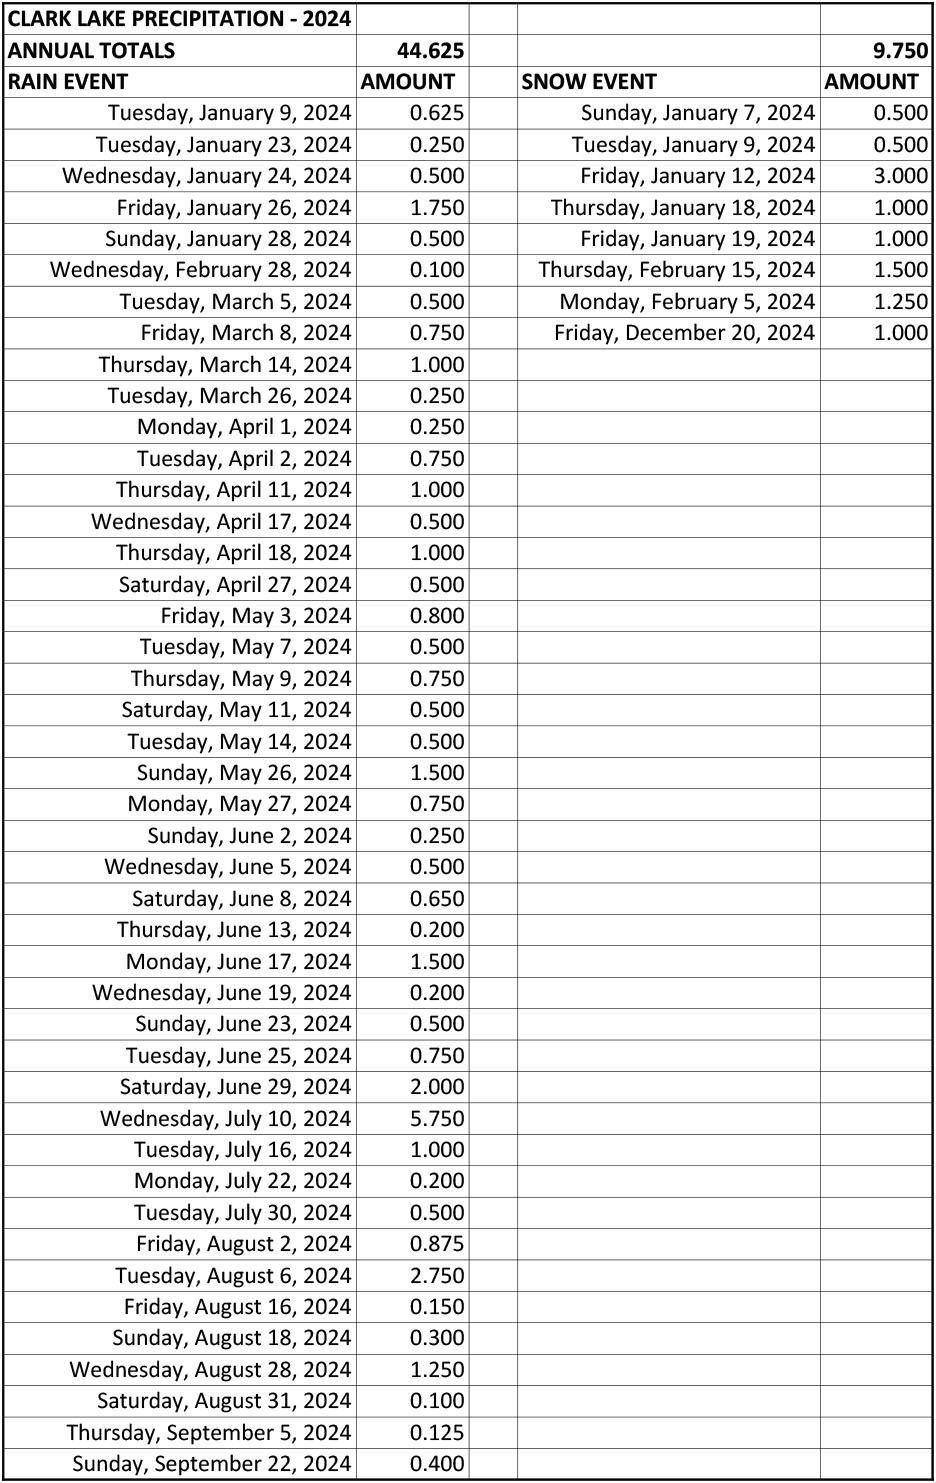
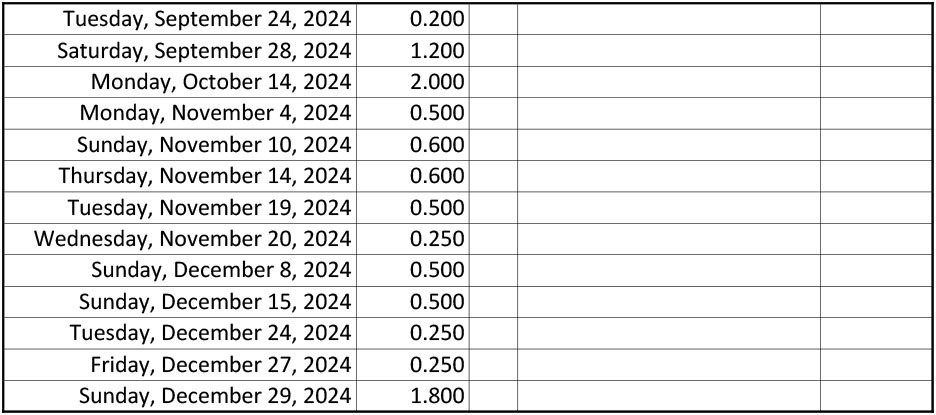
The dates in the chart refer to events, as there was no automatic cutoff at midnight. The goal was to use a date in which most of the rain or snow fell.
So, how much rain fell from January 1, 2024 through December 31, 2024, according to these measurements? 44.625 inches. Snowfall? 9.75 inches. Lots of rain, not much snow.
You can find many stories about rain and snow on this website. Just click on the magnifying glass in the upper right of the website and type the word “rain” or “snow” for the results.


It was a wet year. The average annual rainfall for the Jackson area is usually indicated as being around 33 inches
I have always noticed the differing amounts of rain between the east side and the west side
If the weather had been more seasonal from January to bid March, the 6 inches of rain would have buried the Clark in about 72 inches of snow. Add the snow for last year and it would have been a whopper of nearly 80 inches. Looks like it’s time for the ice boats to come out of storage.